Jimmyt wrote: ↑Sun Jul 03, 2022 4:21 pm
In any event, looks like you're getting into the weeds with it. Can't wait to see the results of your efforts!
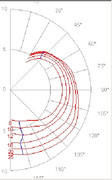
Here it is:
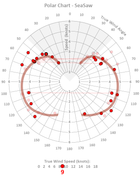
True Wind Speed: maybe 9 knots steady with a swelling to maybe 10 as the hour wore on.
True Wind Direction: due south, between 175 and 195.
Red data is real data. Pale pink data is a
mirror reflection of real data to get a better curve, under the assumption that speeds will be the same on both tacks.
Note on the broad margins of error: collecting data
really should not be done single-handed. Trimming the sails quickly and precisely for a given point-of-sail is critical to getting accurate data.
That being said, clearly, there are some bigger problems with my chart. The most obvious being that I can
apparently sail within up to within 35 degrees of-the-wind.

That's impossible, especially on a Mac.
My first assumption for error is that I poorly derived TWA. I tried to
verify the angle of tack: the four faint red lines connect the two headings immediately before and after tacking. The fact that they are all almost exactly perpendicular to head-to-wind tells me that I derived TWA from my tack data accurately. So, mystery remains.
I notice that there is no
specific tack that was actually less than 90.
In fact, my five tacks were 120°, 110°, 135, 210°, 105°.
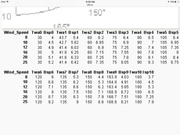
I can post my data if anyone is excited by data analysis.